
What’s Your Real Return? DPI, IRR and the Truth Behind the Numbers
Introduction
In the world of private institutional real estate performance measurement, the market has traditionally emphasized the Internal Rate of Return (IRR). While IRR provides the market with a familiar benchmark metric, investors, consultants and managers are expanding their focus to include other metrics such as Distributed to Paid-In Capital (DPI), Residual Value to Paid-In Capital (RVPI) and Total Value to Paid-In Capital (TVPI).
The market recognizes that no single measure can capture the complexity of investment performance or provide a complete picture of how an investment has performed, especially in today’s environment, where distributions to limited partners (LP) have slowed. This important conversation will also be a focus at the 2026 Visions, Insights & Perspectives (VIP) Americas conference, where Alliance Co-Founder Jennifer Stevens will be speaking further on this topic.
Alliance Global Advisors would like to thank Sarah Cachat, Anthony Pietro and Nick Mone of Townsend Group for providing their valuable insights and performance data that informed this blog.
The Traditional Role of IRR
IRR has long been regarded as the industry standard for evaluating the performance of closed-end and defined duration investments. It measures the discount rate that zeroes out the net present value of cash flows, effectively combining capital invested, distributions and remaining portfolio value into one annualized return figure. Its appeal lies in its ability to standardize cross-fund comparisons and account for the timing of cash flows, often through vintage year analyses.
Yet, IRR is not without limitations; it is ultimately a discount rate, which can sometimes distort actual realized returns. It is no industry secret that managers can influence IRR through the timing of distributions or naturally in the lifecycle of the investment vehicle. These influences add further complexity to the measurement of performance.
DPI is Gaining Traction
DPI, by contrast, offers a tangible and straightforward measure: the ratio of cumulative distributions to the capital invested by limited partners. In today’s market, where liquidity has tightened and distributions are less frequent, DPI is gaining traction, as it highlights the importance of realized cash flows over projected returns.
Institutional consultants have long recognized the need for a comprehensive lens. Townsend Group has evaluated performance using multiple metrics for decades, enabling investors to better understand the true returns.
Evaluating Different Performance Metrics
Each metric has its own set of advantages and drawbacks, and the graphic below further explains these.
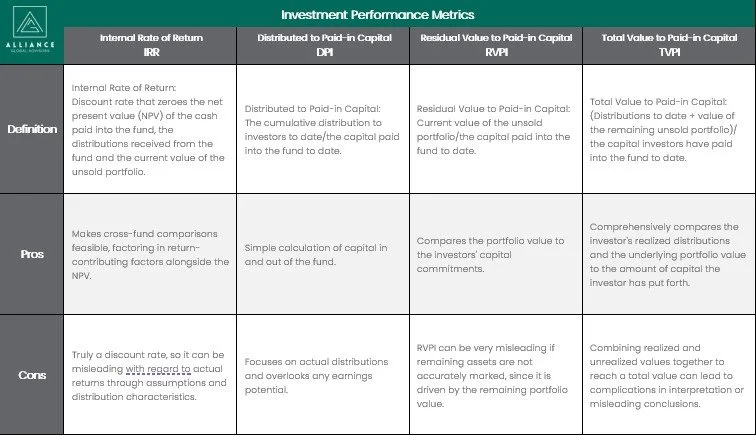
An important nuance across all metrics is the element of time. Performance measures change meaningfully depending on the stage of a fund’s lifecycle. For instance, a high RVPI early in a fund’s life may signal unrealized potential, while the same figure late in a fund’s life could indicate challenges in liquidating assets.
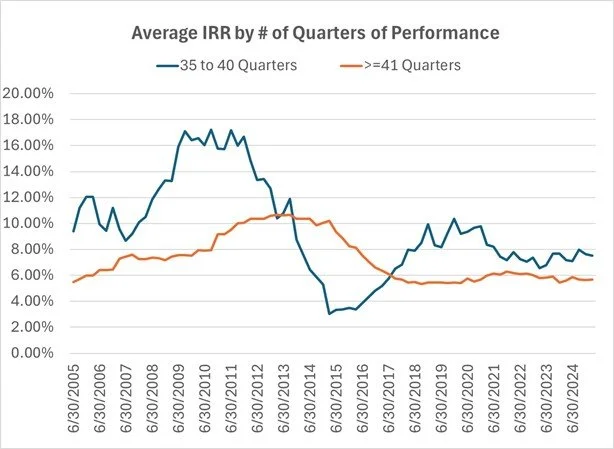
Townsend Group provided the charts below as an example. They illustrate average performance metrics for vehicles with 35–40 quarters of data compared to those with more than 41 quarters. The comparison highlights how time can influence performance, particularly when evaluating younger versus more seasoned vehicles. The variation in returns during market downcycles, as shown in the charts, underscores the importance of assessing all performance metrics when evaluating portfolios.
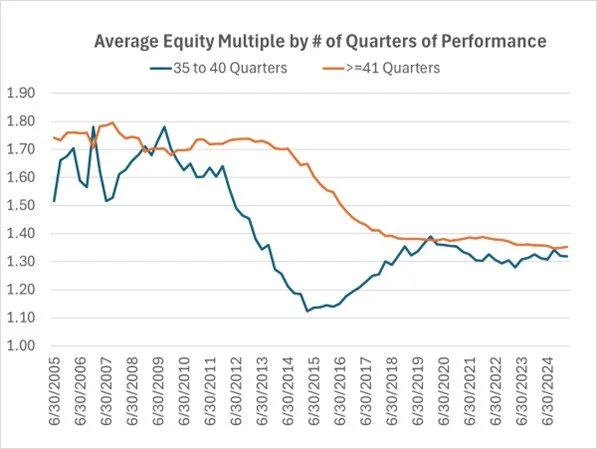
Source: Townsend Group
Institutional limited partners largely defer to time-weighted returns (TWR) and the traditional equity multiple (EM) when evaluating performance across managers.
TWR neutralizes the impact of cash flow timing, making them particularly useful for comparing performance across managers and strategies consistently. For open-end fund vehicles, or when benchmarking against public indices, LPs often require managers to report TWR alongside IRR. In fact, TWR also provides many LPs with a practical way to assess their entire portfolio’s performance against an index—particularly relevant in the U.S., where the NCREIF ODCE Index is the predominant benchmark for most LPs.
EM, often favored for its simplicity, reflects how much total value (realized and unrealized) has been created per single dollar invested. The metric is more straightforward than IRR or TVPI and remains an intuitive measure for many LPs because it clearly shows how capital has grown over time.
Together, these two metrics underscore the need for a comprehensive toolkit, enabling LPs to evaluate managers on cash flow efficiency, consistency and total value creation.
“Meaningful performance analysis starts with strong data integrity and sufficient sample sizes,” said Jennifer Stevens, Co-Founder and Managing Partner of Alliance Global Advisors. “Townsend Group showcased its leadership in this area by contributing data that helped launch the first widely accepted private real estate fund benchmark in the U.S. with NCREIF—culminating in the creation of the NFI-ODCE in 2006. However, Townsend’s commitment to data-driven insights dates back much further. Since the late 1970s, the firm has leveraged its proprietary datasets to guide investment decisions, track market trends and deliver innovative solutions to clients. It represents one of the most comprehensive and historically rich data resources in the global private real assets industry.”
Anthony Pietro from Townsend Group agrees, “Understanding true relative performance requires the evaluation of multiple risk and return factors inherent in an investment strategy, not just IRR.”
Conclusion
Focusing on a single metric, such as IRR, DPI, TVPI or RVPI, can provide an incomplete or even misleading view of performance. For instance, IRR may appear strong without meaningful capital returned, while DPI highlights realized gains but overlooks unrealized value. RVPI captures remaining value but can overstate results before full realization, and TVPI offers a blended view that may obscure timing and liquidity risks.
Each measure provides a unique lens, and when viewed together, they help investors strike a balance between near-term liquidity and long-term value creation. As the charts above illustrate, performance can shift significantly with market cycles, underscoring the importance of considering multiple metrics—especially during periods of volatility.
At Alliance, we take a holistic approach to performance, unlocking deeper insights, enabling more intelligent decisions and strengthening alignment across stakeholders. Interested in how Alliance can support your platform? Let’s connect.
ABOUT ALLIANCE GLOBAL ADVISORS:
Alliance Global Advisors is a women-owned consulting firm focused on empowering the institutional investment community to elevate best practices. Advising clients with over $970 billion in assets under management, Alliance partners with organizations to provide an independent perspective and innovative approach to critical strategic initiatives. Our partnerships allow senior management teams to focus on what matters most: diligently managing client capital, creating value and delivering exceptional returns in a performance-driven market.
Disclaimer: This blog was originally published in October 2025 and will be updated periodically to reflect changes in the industry. The content may contain or cite personal and/or professional opinions that differ from the views of Alliance Global Advisors.